 Dear forum visitor,
It looks as though you have not registered for a forum account, or are not signed in. In order to participate in current discussions or create new threads, you will need to register for a forum account by clicking on the link below.
Dear forum visitor,
It looks as though you have not registered for a forum account, or are not signed in. In order to participate in current discussions or create new threads, you will need to register for a forum account by clicking on the link below.
Diellashana
Member
[Edit for disclaimer - This is my progression of a model. It starts off with too many errors. It shows my thought process over time. My most up to date thoughts will be further down in the thread if they exists.]
Beginning the game recently I needed a way to value my buildings. I have browsed a few techniques and tools but came up with my take on how to value tile efficiency (Making one’s own spreadsheets is FUN!).
Here is what I have come up with for Elven buildings so far:
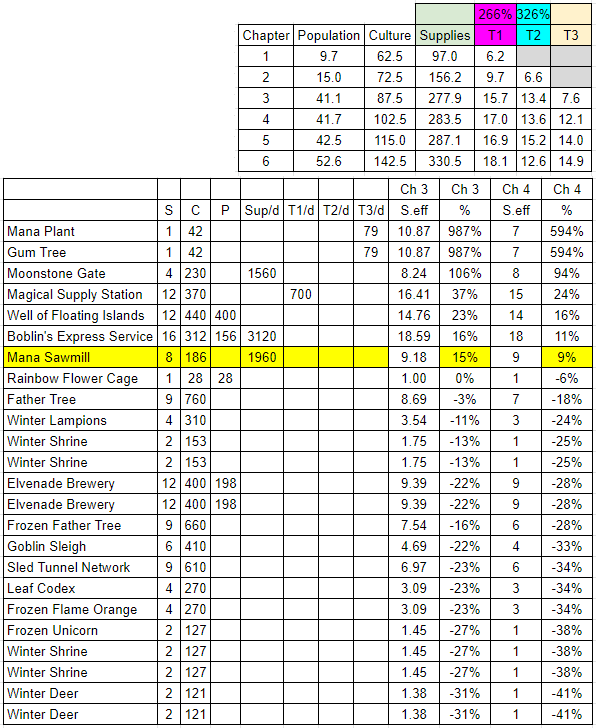
Culture:
Everything starts with culture. For each chapter I took the highest non-gem culture density building at that level. Example: In chapter 1, the highest density non-gem culture building is the flying boat, 250 culture / 9 spaces = 27.8 culture per space. Anything with culture now gets an added tile value for every 27.8 culture in this chapter.
Population:
Residences provide the base resource for population. They have population cost as well as culture cost. The amount of space a residence uses is it’s base space cost plus the space required to cover its culture cost. Example: The Chapter 3, level 15 elven residence provides a cumulative population of 420, requires a cumulative culture cost of 118, and takes up 9 spaces. The total space cost is 9 + 118 / 48.9 = 11.4 spaces. The tile density then becomes 420 population / 11.4 = 36.8 population per space.
Inference between chapters without upgrades:
Not all chapters have level upgrades for buildings so we need a way to infer a value for chapters without upgrades. We do this by updating the relative culture cost at that chapter while keeping base costs the same. This has an effect of making buildings more effective at higher chapters even though they haven’t been replaced. Within various levels of a chapter sometimes a building will lose efficiency; In that case the value listed above is the highest value for that chapter. Inference example: Chapter 4 has no upgrade for elven residences, we will use chapter 3 variables but use the updated culture density ratio: 9 spaces + 118 culture / 60 = 11.0. We now generate the same amount of population but only require 11 and not 11.4 spaces as we did in the previous chapter.
Use examples:

The way I compare is to consider how a building is performing in effective space to its actual space as a percent, 100 x (Effective space - actual space) / actual space, then sort the list. Example: My Mana Plant takes up 1 space but is performing as if it were about 6 spaces! Very nice.
First a few things. I have to watch out for variable units. Some buildings are different from the base calculation. Sometimes I see supplies per hour or day or per 21 hours and have to make adjustments. Goods buildings do not get relic bonuses. For goods I’ll divide their effectiveness by my current maximum relic bonus plus 1.
I have Mana Sawmill highlighted because it’s an option for me to produce in my magic academy. I put in the numbers and quickly copied the calculations down. It came in at 25% above my current chapter and only 14% above the next chapter. I’ll pass.
I’ve also noticed that my Elvenade Brewery is under performing. It could be replaced by another Well of Floating Islands if I really needed the population and wanted to increase my efficiency. Those will be first to be replaced in the next event.
Another observation is that the Moonstone Library set buildings I have are really, really good. I'll keep those upgraded.
I’m looking forward to the next event starting soon (The Forbidden Ruins). This is how I’ve set myself up to compare the buildings I’ll get from that event against my old Winter Magic event buildings. I hope this has been entertaining.
Beginning the game recently I needed a way to value my buildings. I have browsed a few techniques and tools but came up with my take on how to value tile efficiency (Making one’s own spreadsheets is FUN!).
Here is what I have come up with for Elven buildings so far:
| Chapter | Population | Culture | Supplies | T3 | T2 | T1 |
| 1 | 9.4 | 27.8 | 4.8 | 1.76 | ||
| 2 | 13.9 | 33.3 | 7.2 | 2.69 | 2.62 | |
| 3 | 36.8 | 48.9 | 13.0 | 4.86 | 5.46 | 4.34 |
| 4 | 38.3 | 60.0 | 13.5 | 7.48 | 5.67 | 4.71 |
| 5 | 39.3 | 70.0 | 13.9 | 8.74 | 6.45 | 4.72 |
| 6 | 48.0 | 96.0 | 16.0 | 9.38 | 5.34 | 5.09 |
Derivations
Culture:
Everything starts with culture. For each chapter I took the highest non-gem culture density building at that level. Example: In chapter 1, the highest density non-gem culture building is the flying boat, 250 culture / 9 spaces = 27.8 culture per space. Anything with culture now gets an added tile value for every 27.8 culture in this chapter.
Population:
Residences provide the base resource for population. They have population cost as well as culture cost. The amount of space a residence uses is it’s base space cost plus the space required to cover its culture cost. Example: The Chapter 3, level 15 elven residence provides a cumulative population of 420, requires a cumulative culture cost of 118, and takes up 9 spaces. The total space cost is 9 + 118 / 48.9 = 11.4 spaces. The tile density then becomes 420 population / 11.4 = 36.8 population per space.
Inference between chapters without upgrades:
Not all chapters have level upgrades for buildings so we need a way to infer a value for chapters without upgrades. We do this by updating the relative culture cost at that chapter while keeping base costs the same. This has an effect of making buildings more effective at higher chapters even though they haven’t been replaced. Within various levels of a chapter sometimes a building will lose efficiency; In that case the value listed above is the highest value for that chapter. Inference example: Chapter 4 has no upgrade for elven residences, we will use chapter 3 variables but use the updated culture density ratio: 9 spaces + 118 culture / 60 = 11.0. We now generate the same amount of population but only require 11 and not 11.4 spaces as we did in the previous chapter.
Use examples:
The way I compare is to consider how a building is performing in effective space to its actual space as a percent, 100 x (Effective space - actual space) / actual space, then sort the list. Example: My Mana Plant takes up 1 space but is performing as if it were about 6 spaces! Very nice.
First a few things. I have to watch out for variable units. Some buildings are different from the base calculation. Sometimes I see supplies per hour or day or per 21 hours and have to make adjustments. Goods buildings do not get relic bonuses. For goods I’ll divide their effectiveness by my current maximum relic bonus plus 1.
I have Mana Sawmill highlighted because it’s an option for me to produce in my magic academy. I put in the numbers and quickly copied the calculations down. It came in at 25% above my current chapter and only 14% above the next chapter. I’ll pass.
I’ve also noticed that my Elvenade Brewery is under performing. It could be replaced by another Well of Floating Islands if I really needed the population and wanted to increase my efficiency. Those will be first to be replaced in the next event.
Another observation is that the Moonstone Library set buildings I have are really, really good. I'll keep those upgraded.
I’m looking forward to the next event starting soon (The Forbidden Ruins). This is how I’ve set myself up to compare the buildings I’ll get from that event against my old Winter Magic event buildings. I hope this has been entertaining.
Last edited:
 bldgs offered... ( per tile used )-(
 ") this also holds true for CH 1-6 players )
this also holds true for CH 1-6 players )